Your GPU dashboard is lying to you
The standard GPU utilization metric doesn’t measure what it claims to. Here’s what accurate measurement looks like, and an open-source tool to bring it to every AI deployment.
This has real consequences. New hardware takes months to acquire, energy costs are climbing alongside AI’s surging electricity demand, and every dollar spent on unnecessary GPUs is a dollar not spent on the models themselves. Accurate measurement is the foundation, and Systalyze is the optimization platform built on top of it.
The AI industry has a measurement problem
The world is on the brink of an AI compute crisis. The electricity demand of AI clusters is rising quickly, lead times for GPUs stretch into months, and NVIDIA H100 one-year rental pricing rose almost 40% from October 2025 to March 2026. Getting more hardware is slow, expensive and, for many organizations, simply not an option.
That puts optimization at the center of what every enterprise is trying to achieve. But working across many production AI deployments, we kept encountering the same surprising reality: most teams had no idea how inefficiently their GPUs were actually running. They assumed high utilization because their dashboards said so. Before anyone can close a performance gap, they have to be able to see it.
The GPU utilization metric does not measure how hard your GPU is working. It measures whether your GPU is doing anything at all. If at least one kernel is executing throughout the sampling window, the metric can read 100%, whether the GPU is using a fraction of a percent of its compute capacity or saturating it. That drives bad decisions, like buying more GPUs in the belief that existing ones are at capacity.
What nvidia-smi is actually telling you
The GPU samples a binary signal, is at least one kernel scheduled right now?, and averages it over a sampling window, typically one second. If one kernel ran for 400 ms of a one-second window, nvidia-smi reports 40%. If a single tiny kernel ran the whole window on one Streaming Multiprocessor, it reports 100%. An H100 has 132 SMs with 17,424 cores in total, and nvidia-smi treats one busy core and thousands of busy cores identically.
The metric was designed for graphics pipelines, where knowing whether the GPU was idle or active was useful. It has not been updated for AI workloads, where a model can run continuously while using a small fraction of the GPU’s capacity. And the limitation propagates through the whole stack: Weights & Biases logs it as gpu.{i}.gpu, Amazon CloudWatch’s metric is literally named nvidia_smi_utilization_gpu, GCP Monitoring and Azure Monitor use the same driver counter, and rocm-smi reports the same metric on AMD.
Dashboards say 100%. Reality can be as low as 1%.
To show how severe this is, we ran square matrix multiplications in a loop on an NVIDIA H200 at three sizes, N = 256, 1024 and 4096, and profiled them with both nvtop and Utilyze.
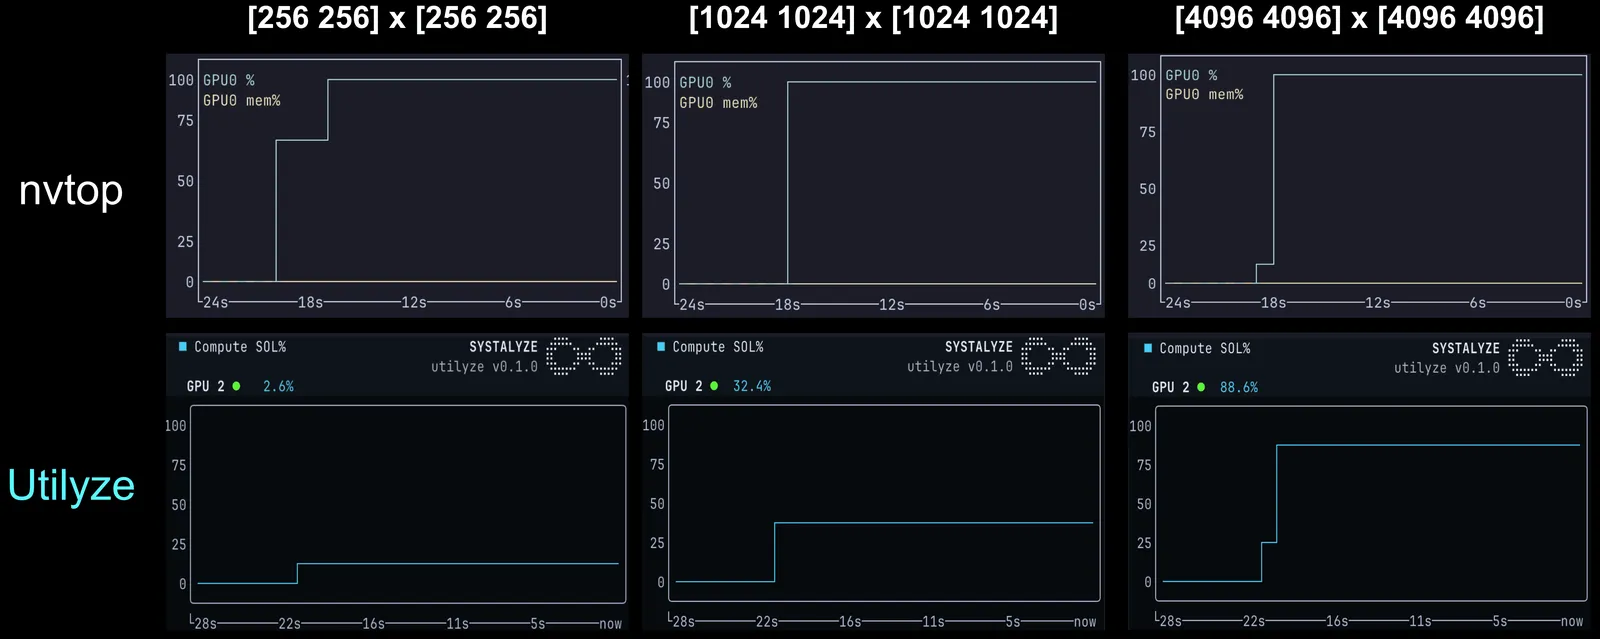
nvtop is invariant to workload intensity. Utilyze shows compute throughput scaling with matrix size: 2.6% at N = 256, 32% at N = 1024 and 88% at N = 4096.
To validate this, we calculated true utilization directly. A multiplication of two N×N matrices at TF32 precision performs 2·N³ operations; scaling the H200’s 494.5 TFLOPS peak by clock speed gives 1% utilization at N = 256, 32% at N = 1024 and 86% at N = 4096. Utilyze’s hardware-counter measurements land within 2% of that ground truth.
Direct calculation works for a simple matrix multiplication but is intractable for real training, fine-tuning and inference pipelines, with their heterogeneous operators, dynamic shapes and scheduling effects. What’s needed is direct measurement at the hardware level, which is what Utilyze provides.
DCGM-based counters aren’t much better
The most common proxy is DCGM’s “SM Active”: the share of SMs with at least one warp scheduled. It’s an improvement, but it has the same problem one level down. A resident warp may be moving data, waiting on memory or running bookkeeping, and SM Active would still read 100%. To show this, we ran a memory-bound workload on an H200, similar in shape to a decode-heavy LLM inference step, where actual arithmetic throughput is about 6% of the ceiling.
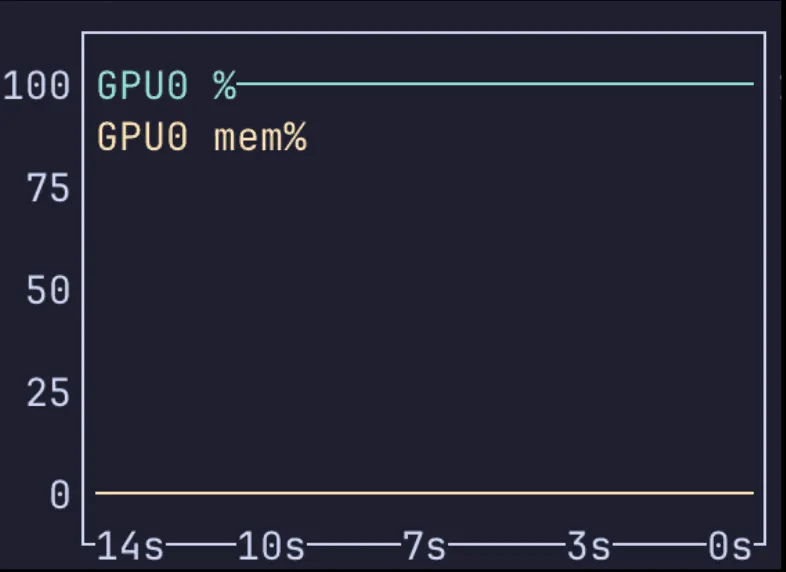
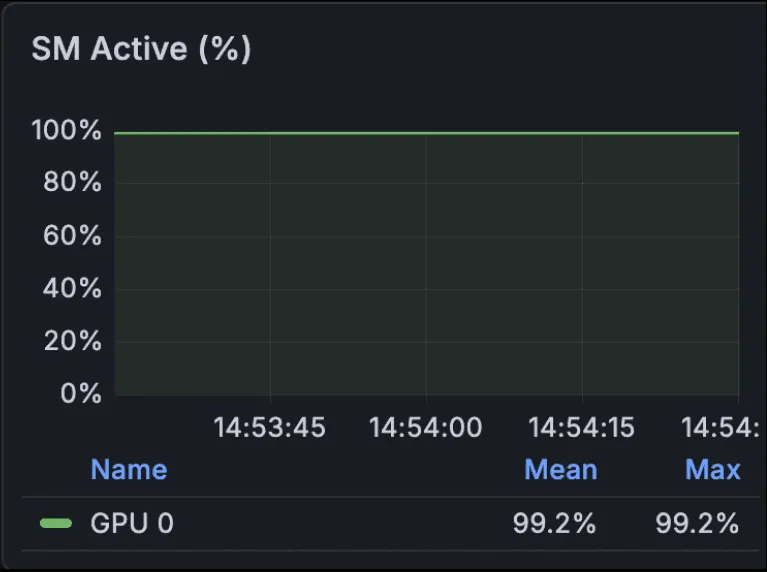
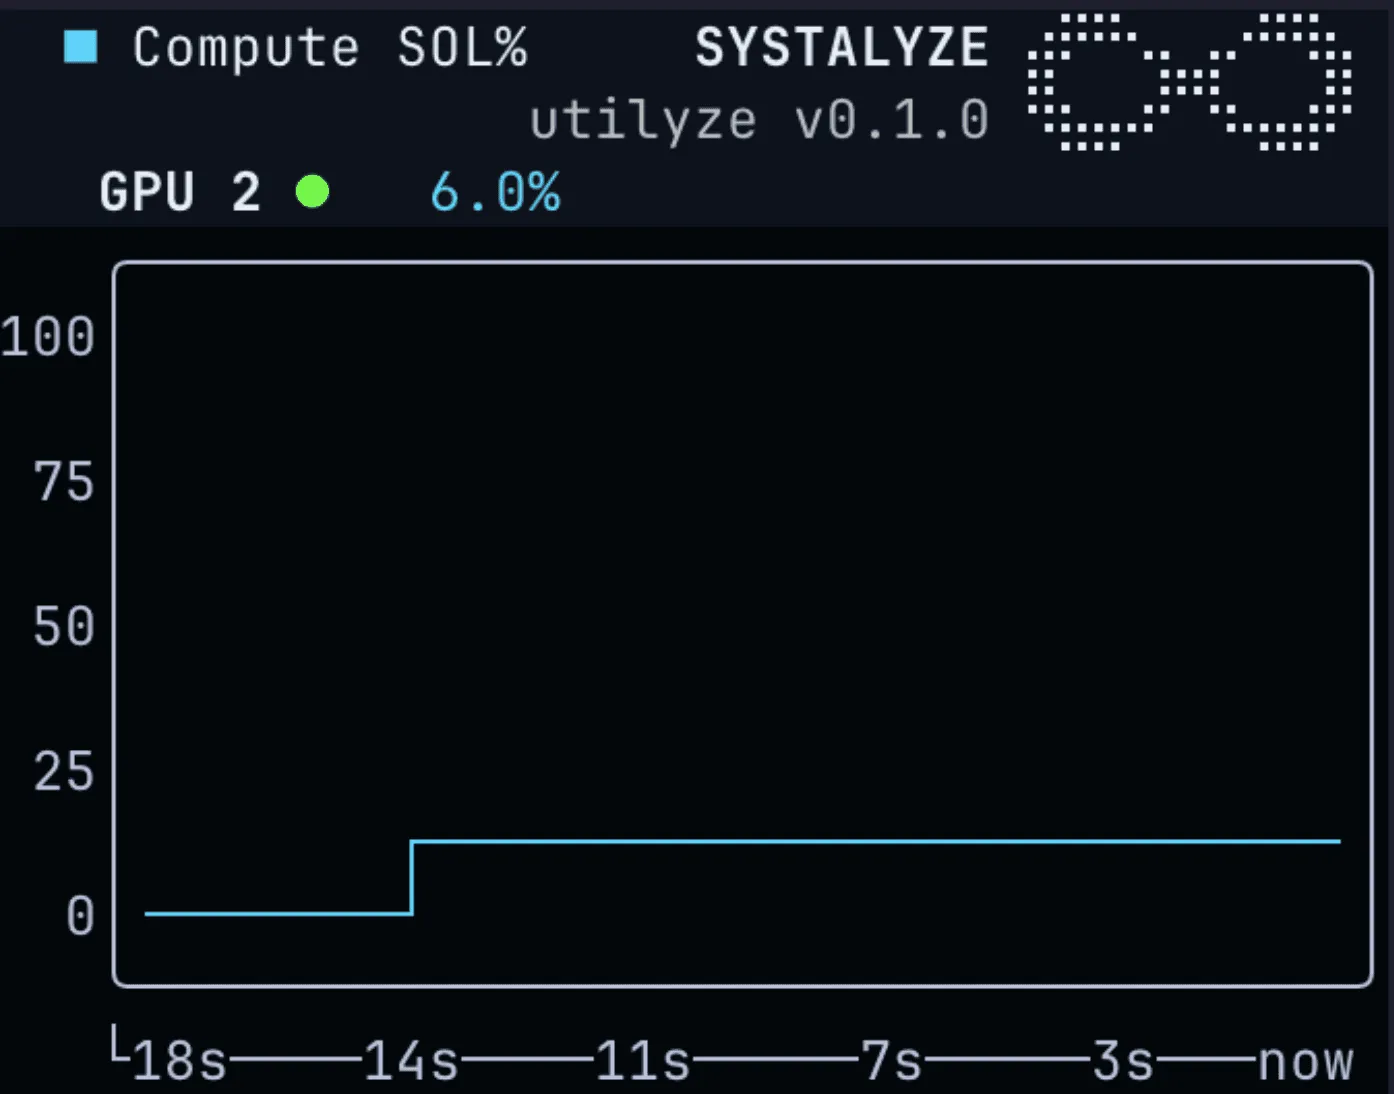
Only Utilyze gets it right. The SMs really do have warps resident the whole time, but those warps are waiting on memory rather than doing math. Other DCGM metrics, like SM issue, SM occupancy and tensor core throughput, don’t show the full picture either, alone or combined.
“Cloud providers and hardware vendors surface this same misleading metric on their dashboards. When that number reads 100%, the natural conclusion is that you need more hardware. The incentives to correct this misimpression are, to put it diplomatically, complicated.”
Introducing Utilyze
Utilyze reports true GPU compute and memory bandwidth utilization as a percentage of the hardware’s theoretical limit, and estimates how much of that limit is practically attainable for your hardware, software stack and workload. It runs in real time with near-zero overhead, so it is safe for production. We use it at Systalyze to monitor, benchmark and validate our own optimizations, and we think everyone should use it.
The Speed-of-Light model
Every AI operation on a GPU is bound by two physical limits: how fast the math units execute arithmetic, and how fast data moves between memory and those units. The Speed-of-Light (SOL) model, derived from the roofline model, captures both. Utilyze shows two headline numbers live: Compute SOL % (achieved FLOPs ÷ peak FLOPs) and Memory SOL % (achieved bandwidth ÷ peak bandwidth). Whichever is higher tells you whether the workload is compute-bound or memory-bound, and where to optimize first.
Why 100% isn’t the target
No real workload reaches the theoretical peak. Kernel launches have overhead, data moves through the memory hierarchy, threads synchronize, GPUs communicate, and Mixture-of-Experts routing creates irregular memory access. Every deployment has a natural ceiling below 100%, which we call the Attainable SOL %.
The gap between your current SOL % and the Attainable SOL % is your optimization budget. The gap between Attainable SOL % and 100% is the physics of your deployment. If a 120B-parameter inference setup runs at 30% Compute SOL and its attainable ceiling is 35%, you’re close to the limit. If the ceiling is 65%, you have 35 points of recoverable performance, and the right move is optimization, not procurement.
Why Utilyze is different
Performance engineers usually reach for Nsight Compute (ncu) or Nsight Systems (nsys). Both are built for offline analysis. ncu replays each kernel many times, slowing workloads 10× to 100×, which rules it out for live traffic. nsys avoids the slowdown but doesn’t report throughput at all.
Utilyze instead cycles through GPU performance counters across time windows using NVIDIA’s Nsight Perf SDK, taking a rolling sample rather than replaying kernels. The overhead is negligible and the measurement is continuous.
Benchmarking Utilyze
Case 1: Prefill-heavy LLM inference
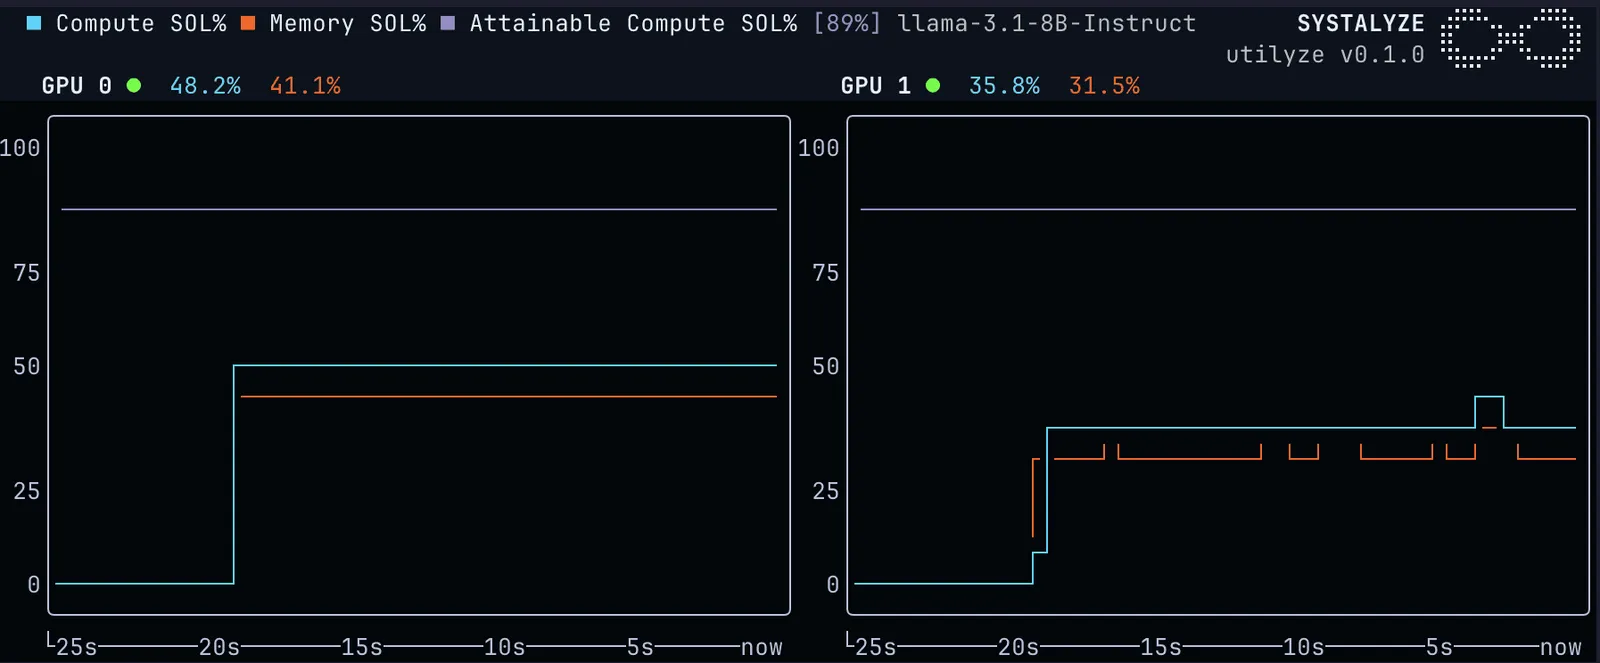
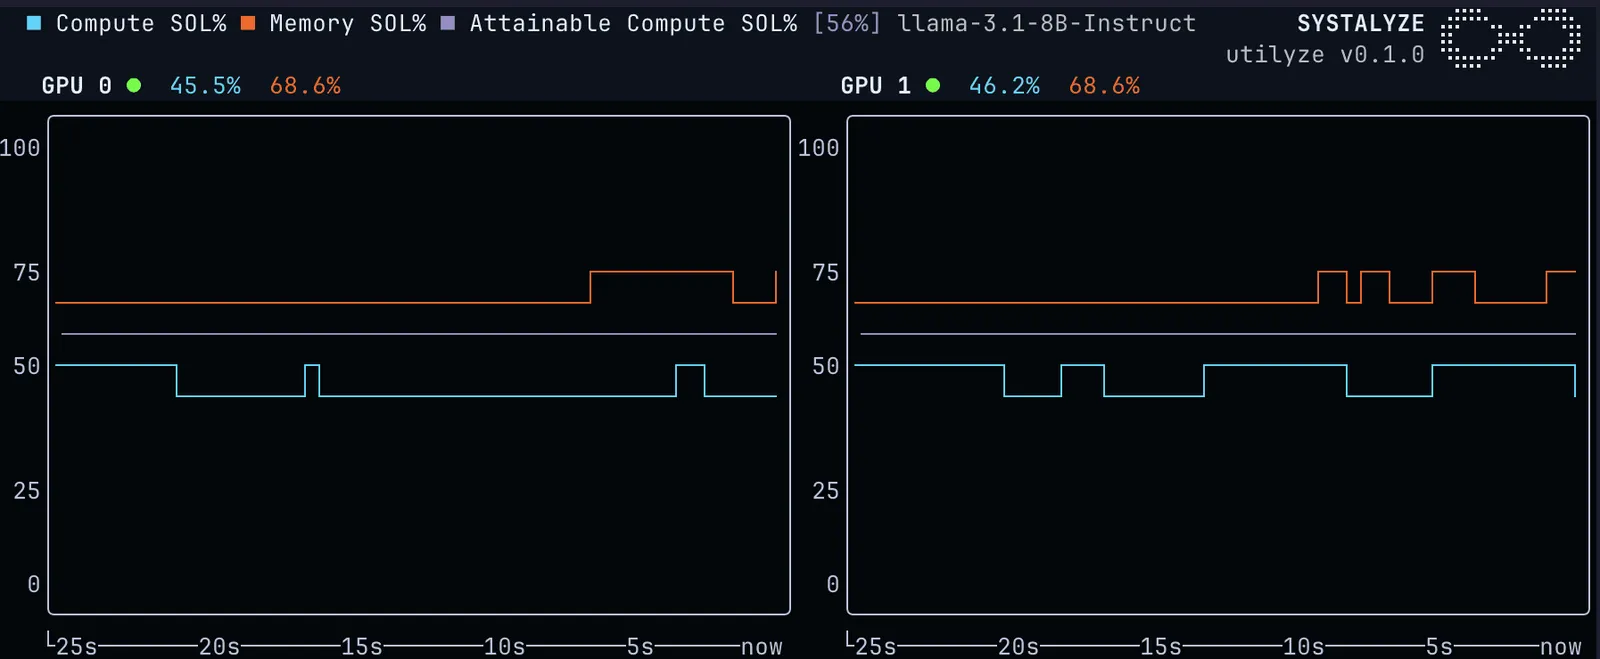
We ran Llama-3.1-8B with vLLM 0.19 on two H200s, with an input length of 8,192 tokens, output length of 64 and concurrency of 20. Utilyze shows the GPUs at about 45% Compute SOL against an Attainable SOL of 89%. Memory SOL is lower, so the workload is compute-bound.
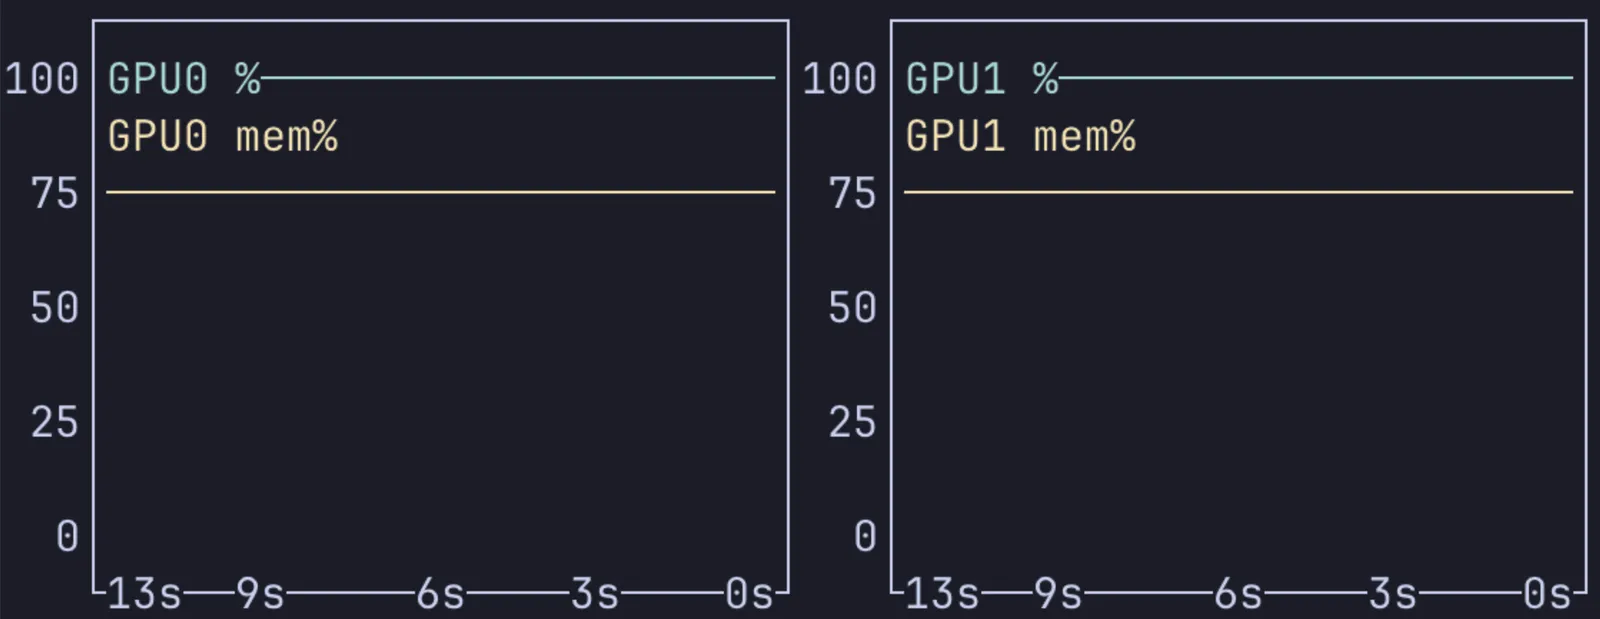
nvtop, meanwhile, sits at 100% the entire time, suggesting nothing can be improved.
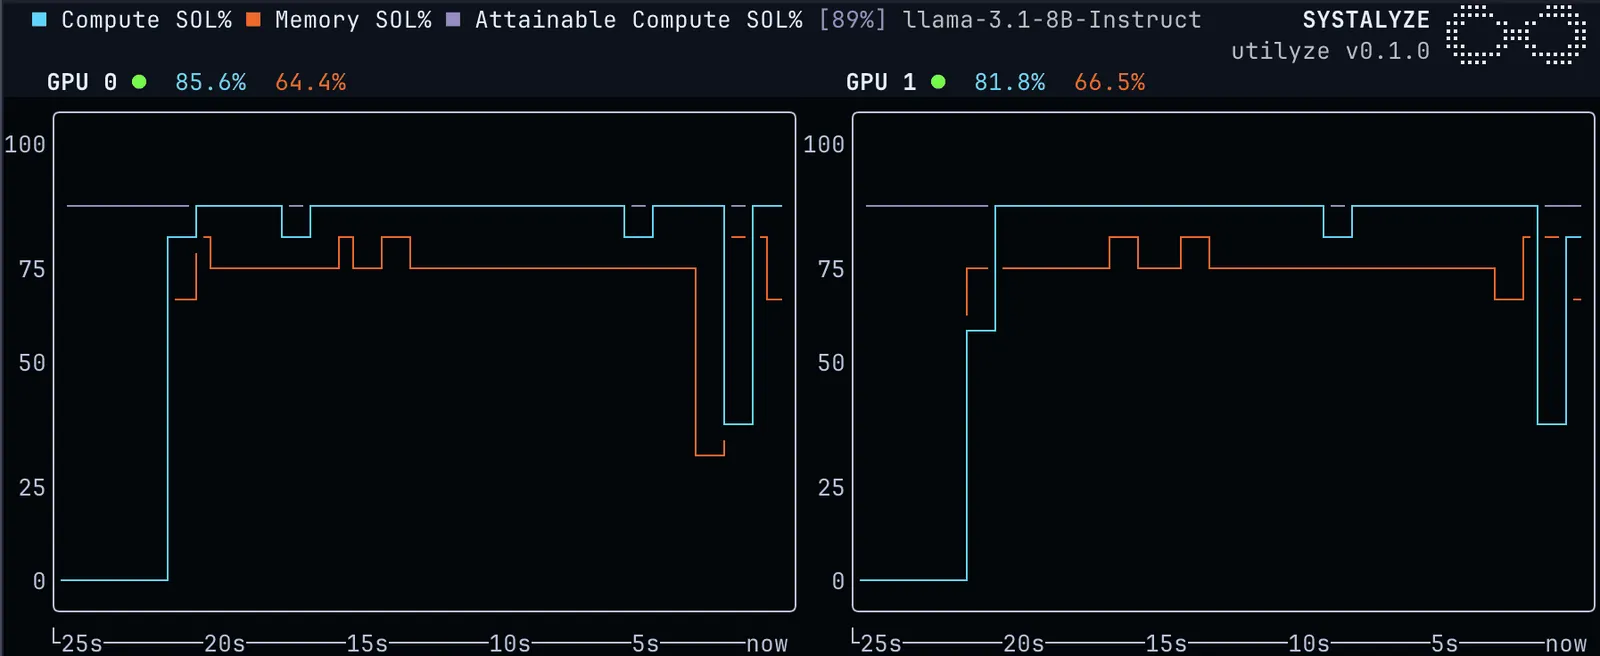
After applying Systalyze’s optimizations, Compute SOL reaches the attainable ceiling. Throughput rises from 52,298 to 73,903 tokens per second, a 40% increase.
Case 2: Decode-heavy LLM inference
With the same unoptimized model on a decode-heavy workload (input 1,024, output 4,096, concurrency 2), Memory SOL is far higher than Compute SOL: the workload is memory-bandwidth bound. For every batch of decoded tokens, the model weights and each user’s KV cache have to move from HBM to the compute units.
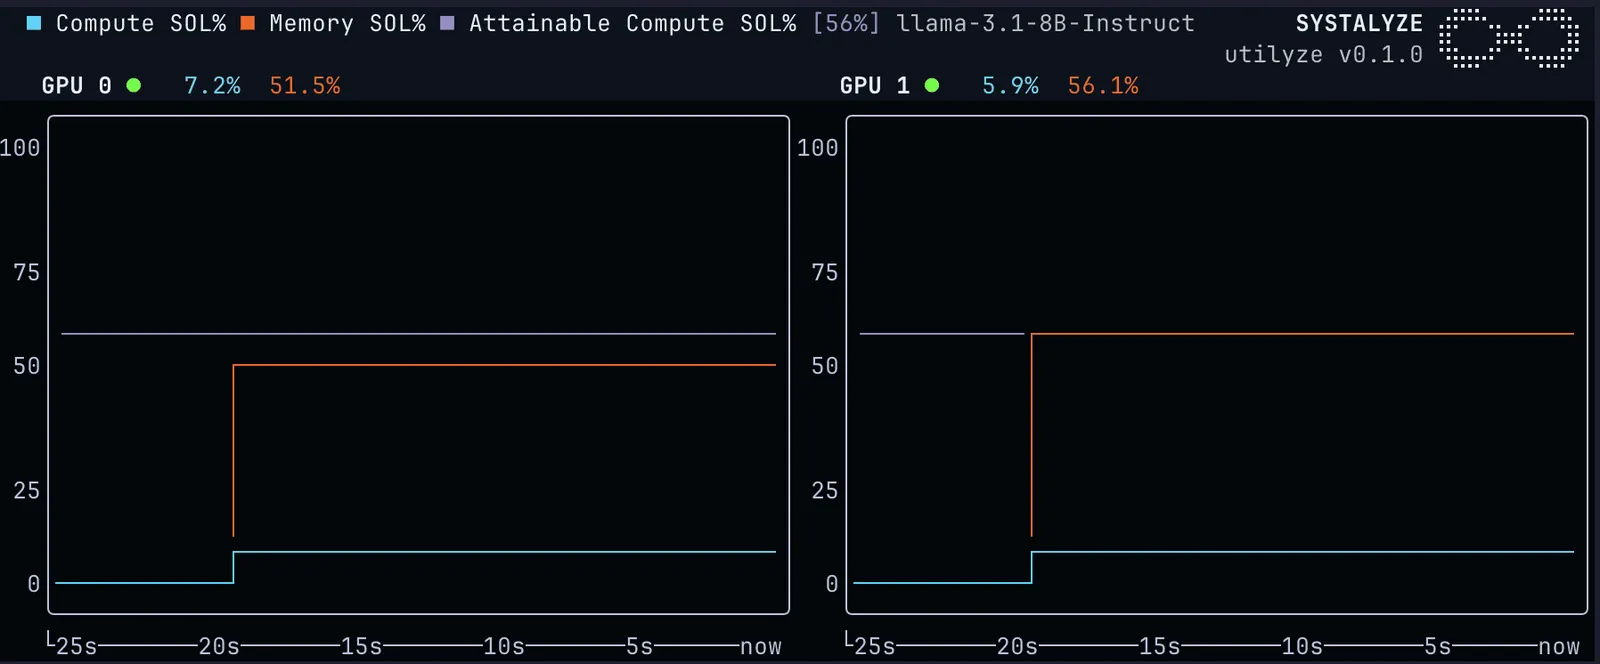
At concurrency 32, both numbers rise. Larger batches read the weights once for more work, raising Compute SOL, while Memory SOL climbs over the run as the KV cache grows.
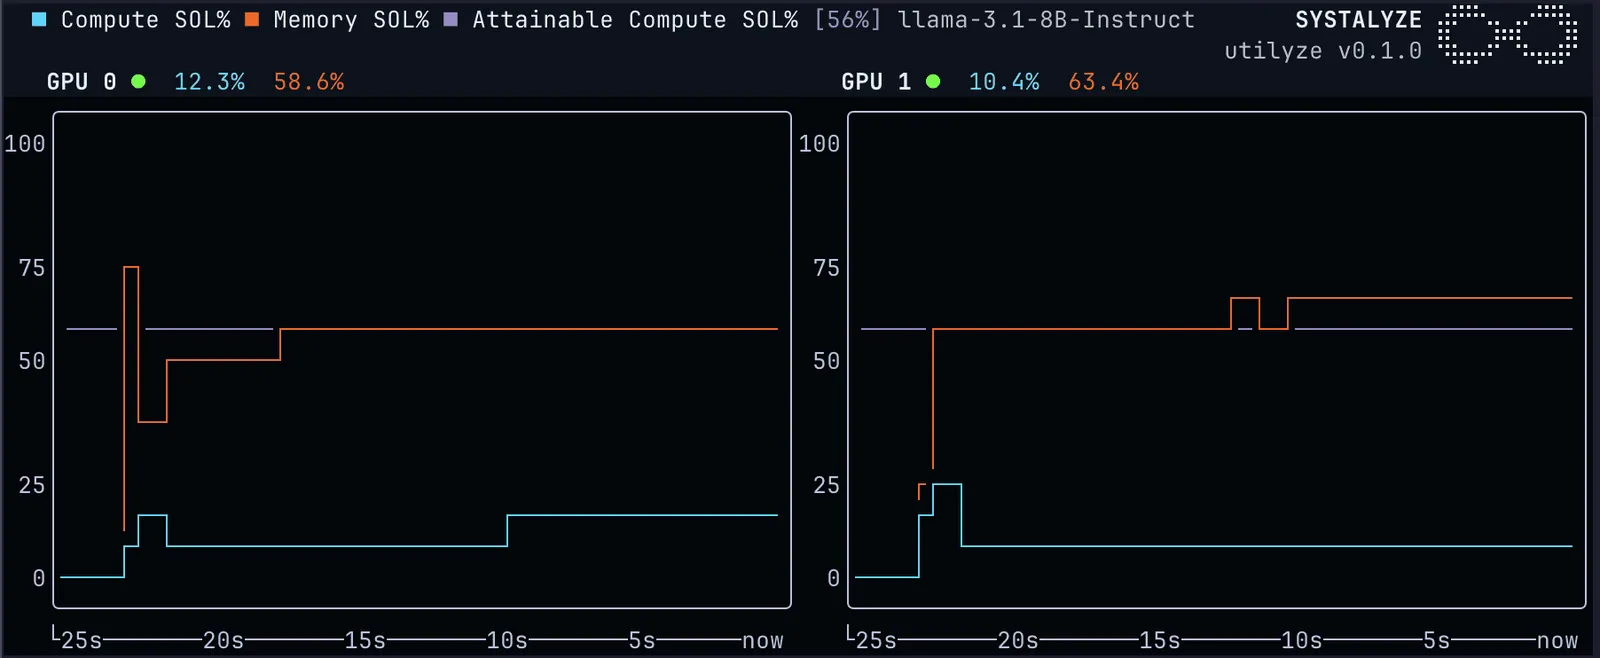
Batching as much as possible, at concurrency 1,024, Compute SOL approaches 46% and nearly reaches the attainable ceiling.
Case 3: LLM fine-tuning
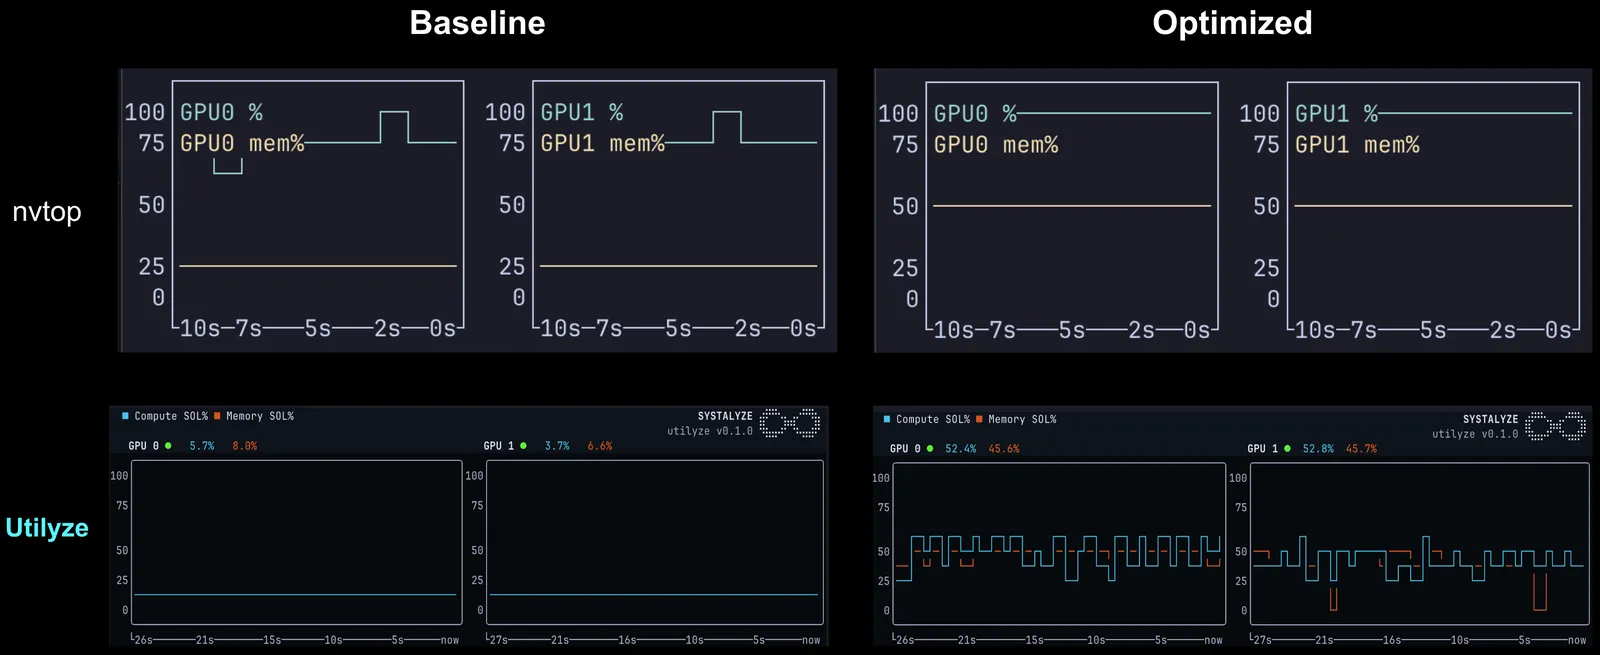
Fine-tuning Llama-3.1-8B with LoRA on two H200s under default settings, Utilyze reports 1–7% Compute SOL while nvidia-smi reads 80–100%. The frozen base weights stream through HBM every step, producing little arithmetic per byte, and the small adapter matrices are too small to saturate the Tensor Cores. The GPU looks saturated from the outside while its compute units sit largely idle.
Systalyze’s optimizations bring Compute SOL to 40–55%, a 6–8× improvement in actual compute throughput, reflected directly in training step time.
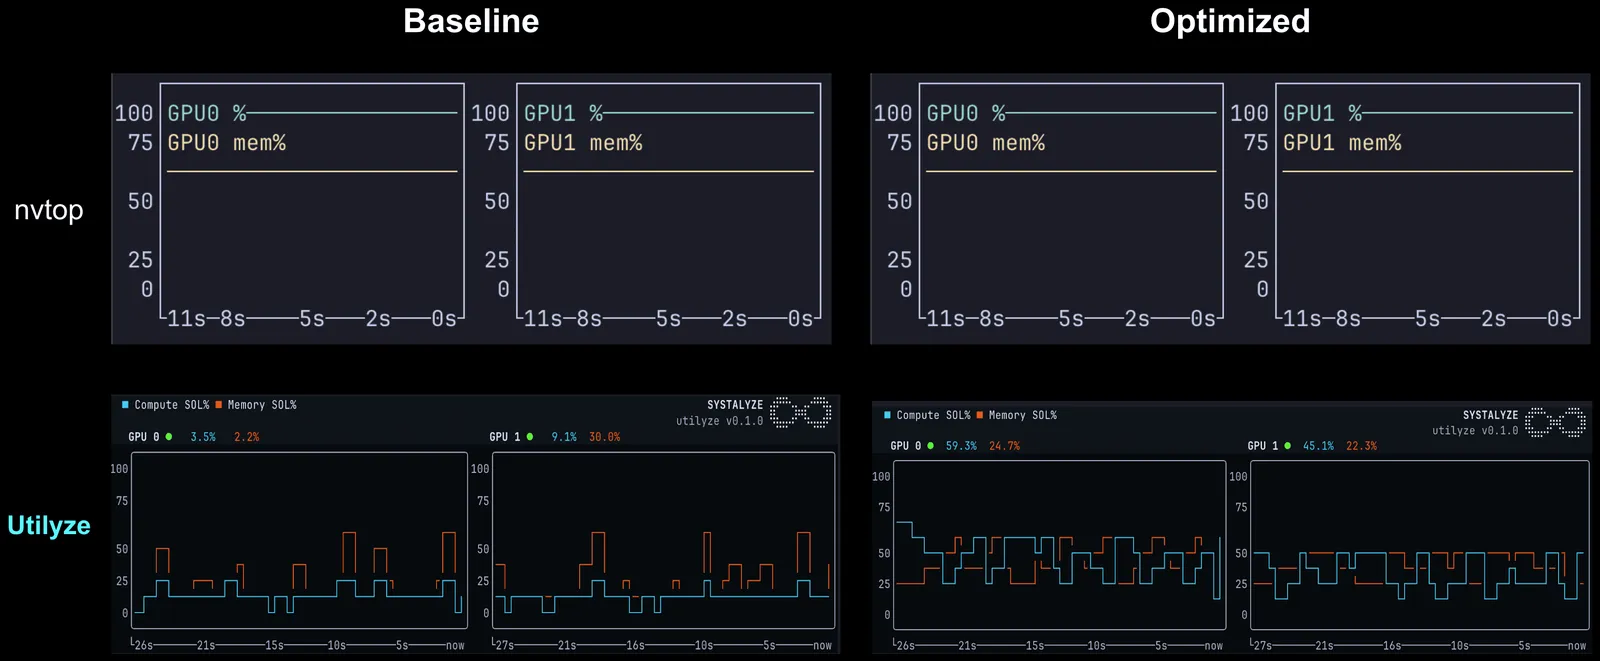
For a harder case, a full fine-tune of gpt-oss-20b on four H200s runs at 3–15% Compute SOL while nvidia-smi reads 100%. It is a Mixture-of-Experts model with 20B total parameters, but only 3.6 billion parameters activate per token. The model does not fit on one H200, so the training framework shards parameters, gradients and optimizer states across all four GPUs with communication every step. Tensor Cores want large uniform matrix multiplications, and MoE gives them small uneven chunks, with routing and token shuffling that leaves parts of the GPU underused. With Systalyze’s optimizations, utilization rises to 30–60% and the workload shifts from memory-bound to compute-bound. Some of the remaining gap is inherent to MoE sparsity, not a tuning problem: lower per-token training FLOPs and activation costs come with lower GPU utilization.
Optimization as a discipline, not a reaction
Across hundreds of production deployments, we’ve seen that optimization is never a one-time fix. Models get updated, traffic patterns change, and a configuration tuned on A100s behaves differently on H100s. The gap between current and attainable SOL has to be tracked continuously.
Utilyze shows you where you are. Systalyze closes the gap: it uses the same measurement to choose which optimizations will move your deployment toward its attainable ceiling, from CUDA graph compilation and kernel fusion to parallelism strategy and job orchestration, and validates each one against measured impact. Across deployments from sub-billion-parameter models to trillion-parameter frontier models, default configurations consistently leave 2–10× performance on the table.
What we’re asking from the community
Utilyze is free and open source under the Apache 2.0 license. Run it on your workloads and tell us what you find, especially surprising gaps between what other dashboards report and what Utilyze measures. Open a GitHub Discussion in the Utilyze repository with your model, hardware, baseline SOL % and any optimizations you’ve tried. For deeper collaboration, reach us at utilyze@systalyze.com.
The initial release targets NVIDIA hardware. AMD support is on our roadmap; if you’re running MI300X or MI325X and want to collaborate, get in touch.